 INSPIRE-1
Catalog

25 record(s)
Provided by
Type of resources
Available actions
Topics
Keywords
Contact for the resource
Update frequencies
Service types
-
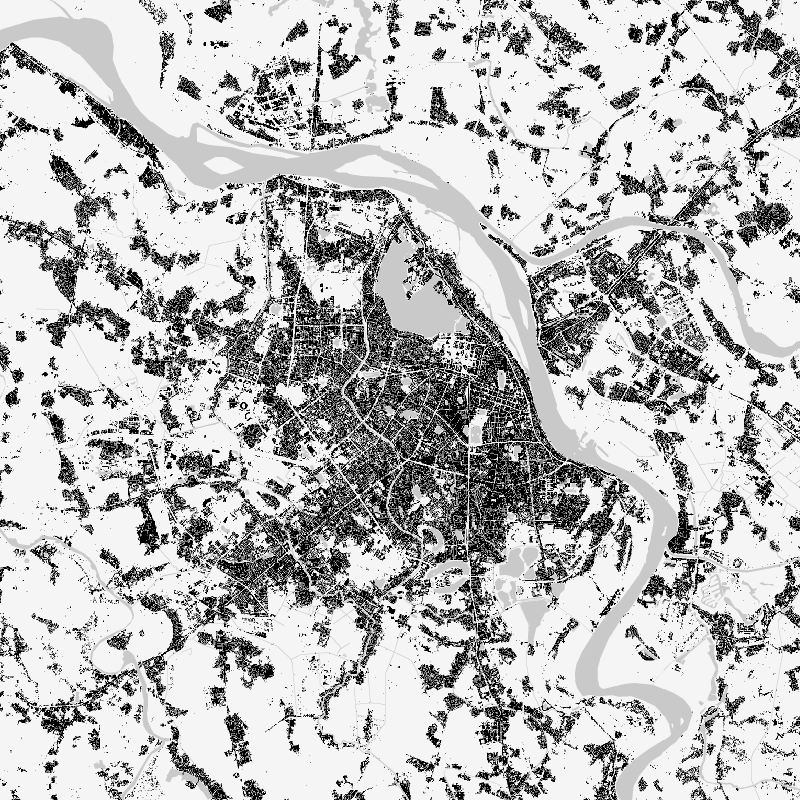
The World Settlement Footprint (WSF) 2019 is a 10m resolution binary mask outlining the extent of human settlements globally derived by means of 2019 multitemporal Sentinel-1 (S1) and Sentinel-2 (S2) imagery. Based on the hypothesis that settlements generally show a more stable behavior with respect to most land-cover classes, temporal statistics are calculated for both S1- and S2-based indices. In particular, a comprehensive analysis has been performed by exploiting a number of reference building outlines to identify the most suitable set of temporal features (ultimately including 6 from S1 and 25 from S2). Training points for the settlement and non-settlement class are then generated by thresholding specific features, which varies depending on the 30 climate types of the well-established Köppen Geiger scheme. Next, binary classification based on Random Forest is applied and, finally, a dedicated post-processing is performed where ancillary datasets are employed to further reduce omission and commission errors. Here, the whole classification process has been entirely carried out within the Google Earth Engine platform. To assess the high accuracy and reliability of the WSF2019, two independent crowd-sourcing-based validation exercises have been carried out with the support of Google and Mapswipe, respectively, where overall 1M reference labels have been collected based photointerpretation of very high-resolution optical imagery.
-
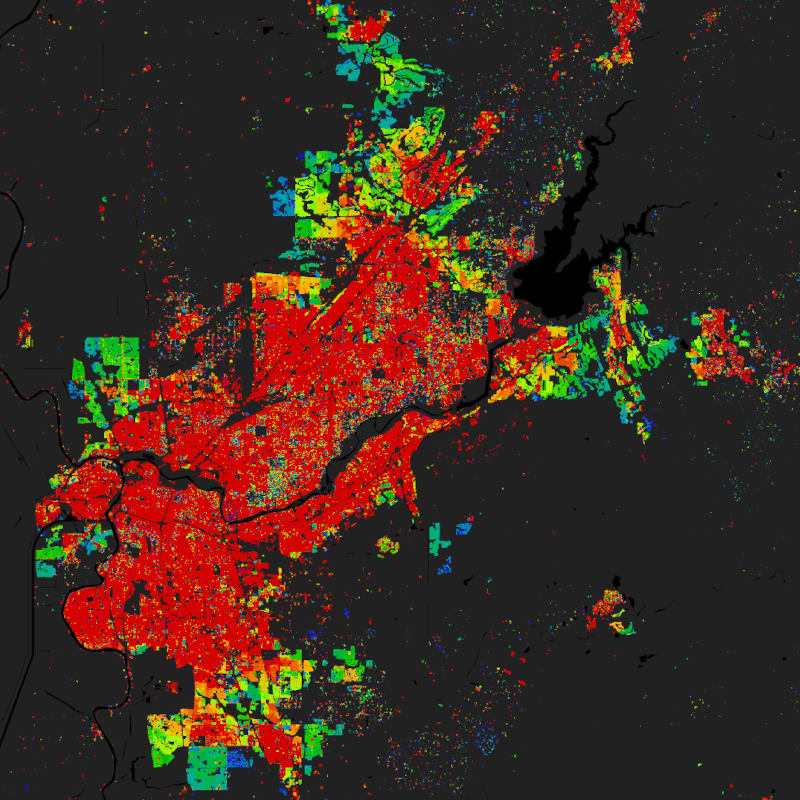
The World Settlement Footprint (WSF) 2019 is a 10m resolution binary mask outlining the extent of human settlements globally derived by means of 2019 multitemporal Sentinel-1 (S1) and Sentinel-2 (S2) imagery. Based on the hypothesis that settlements generally show a more stable behavior with respect to most land-cover classes, temporal statistics are calculated for both S1- and S2-based indices. In particular, a comprehensive analysis has been performed by exploiting a number of reference building outlines to identify the most suitable set of temporal features (ultimately including 6 from S1 and 25 from S2). Training points for the settlement and non-settlement class are then generated by thresholding specific features, which varies depending on the 30 climate types of the well-established Köppen Geiger scheme. Next, binary classification based on Random Forest is applied and, finally, a dedicated post-processing is performed where ancillary datasets are employed to further reduce omission and commission errors. Here, the whole classification process has been entirely carried out within the Google Earth Engine platform. To assess the high accuracy and reliability of the WSF2019, two independent crowd-sourcing-based validation exercises have been carried out with the support of Google and Mapswipe, respectively, where overall 1M reference labels have been collected based photointerpretation of very high-resolution optical imagery. Starting backwards from the year 2015 - for which the WSF2015 is used as a reference - settlement and non-settlement training samples for the given target year t are iteratively extracted by applying morphological filtering to the settlement mask derived for the year t+1, as well as excluding potentially mislabeled samples by adaptively thresholding the temporal mean NDBI, MNDWI and NDVI. Finally, binary Random Forest classification in performed. To quantitatively assess the high accuracy and reliability of the dataset, an extensive campaign based on crowdsourcing photointerpretation of very high-resolution airborne and satellite historical imagery has been performed with the support of Google. In particular, for the years 1990, 1995, 2000, 2005, 2010 and 2015, ~200K reference cells of 30x30m size distributed over 100 sites around the world have been labelled, hence summing up to overall ~1.2M validation samples. It is worth noting that past Landsat-5/7 availability considerably varies across the world and over time. Independently from the implemented approach, this might then result in a lower quality of the final product where few/no scenes have been collected. Accordingly, to provide the users with a suitable and intuitive measure that accounts for the goodness of the Landsat imagery, we conceived the Input Data Consistency (IDC) score, which ranges from 6 to 1 with: 6) very good; 5) good; 4) fair; 3) moderate; 2) low; 1) very low. The IDC score is available on a yearly basis between 1985 and 2015 and supports a proper interpretation of the WSF evolution product. The WSF evolution and IDC score datasets are organized in 5138 GeoTIFF files (EPSG4326 projection) each one referring to a portion of 2x2 degree size (~222x222km) on the ground. WSF evolution values range between 1985 and 2015 corresponding to the estimated year of settlement detection, whereas 0 is no data. A comprehensive publication with all technical details and accuracy figures is currently being finalized. For the time being, please refer to Marconcini et al,. 2021.
-
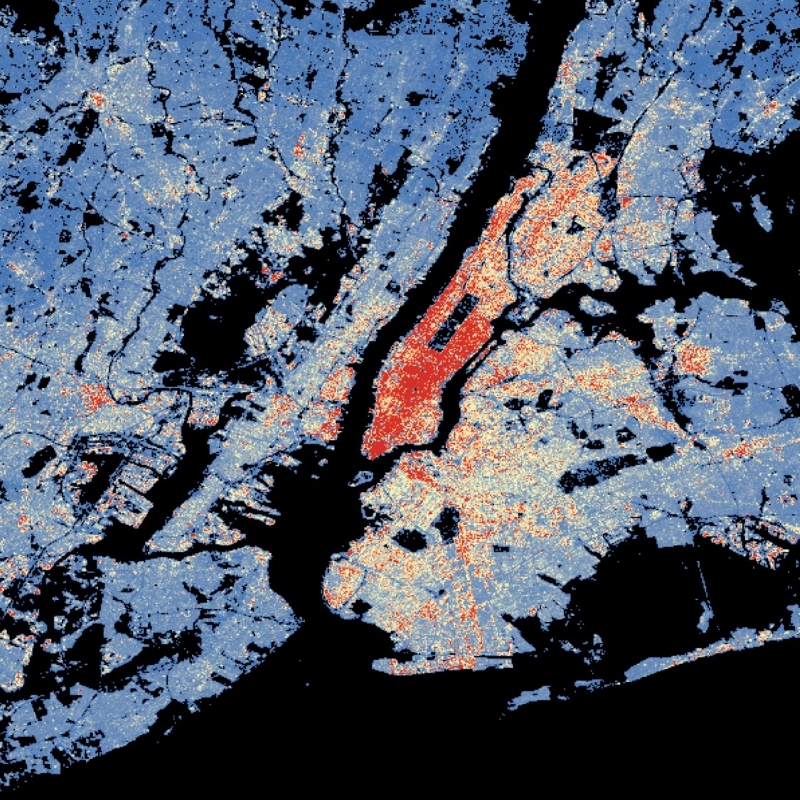
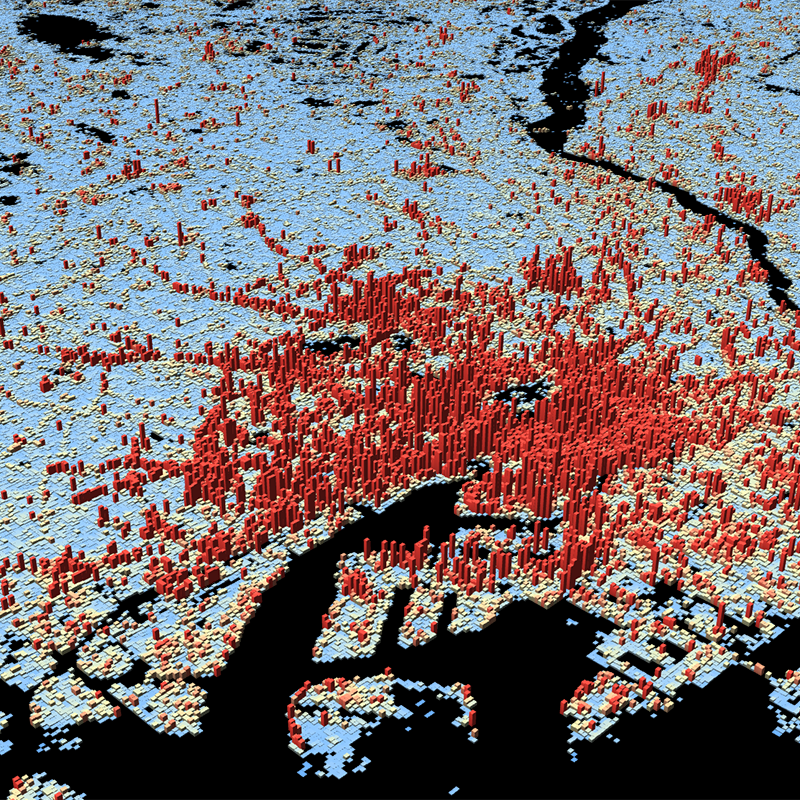
The World Settlement Footprint (WSF) 3D provides detailed quantification of the average height, total volume, total area and the fraction of buildings at 90 m resolution at a global scale. It is generated using a modified version of the World Settlement Footprint human settlements mask derived from Sentinel-1 and Sentinel-2 satellite imagery in combination with digital elevation data and radar imagery collected by the TanDEM-X mission. The framework includes three basic workflows: i) the estimation of the mean building height based on an analysis of height differences along potential building edges, ii) the determination of building fraction and total building area within each 90 m cell, and iii) the combination of the height information and building area in order to determine the average height and total built-up volume at 90 m gridding. In addition, global height information on skyscrapers and high-rise buildings provided by the Emporis database is integrated into the processing framework, to improve the WSF 3D Building Height and subsequently the Building Volume Layer. A comprehensive validation campaign has been performed to assess the accuracy of the dataset quantitatively by using VHR 3D building models from 19 globally distributed regions (~86,000 km2) as reference data. The WSF 3D standard layers are provided in the format of Lempel-Ziv-Welch (LZW)-compressed GeoTiff files, with each file - or image tile - covering an area of 1 x 1 ° geographical lat/lon at a geometric resolution of 2.8 arcsec (~ 90 m at the equator). Following the system established by the TDX-DEM mission, the latitude resolution is decreased in multiple steps when moving towards the poles to compensate for the reduced circumference of the Earth.
-
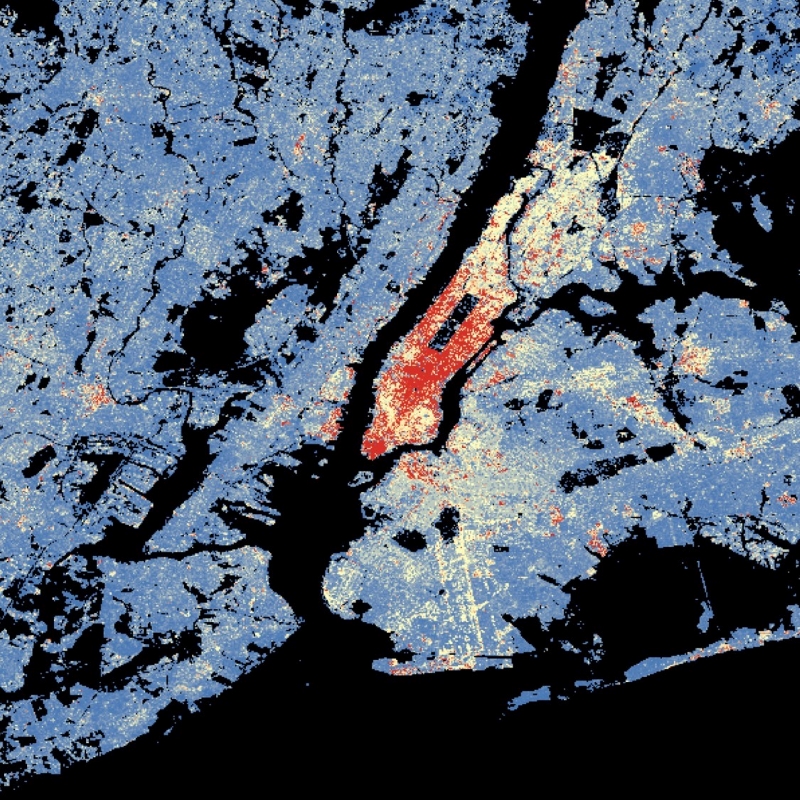
This dataset is a derivative of the WSF3D raster dataset tailored for the web. As a tiled vector dataset, it enables dynamic client-side visualization of the WSF3D metrics
-

This data set represents the yearly, accumulated results of the final (10-day) version of the fire perimeters from the "Burnt Area Daily NRT Incremental Product - Europe, Sentinel-3" dataset. The burn perimeters are spatially and temporally correlated, so that interrelated detections from consecutive observations are combined into a single feature. A perimeter is interpreted as belonging to a given event if a spatial overlap exists within a time frame of 15 days. Besides the geometry, attribute information is also combined while considering the size of the perimeter as a weighting factor. Each feature contains information about the final fire perimeter, Date/Time of the first detection, and the averaged burn severity
-
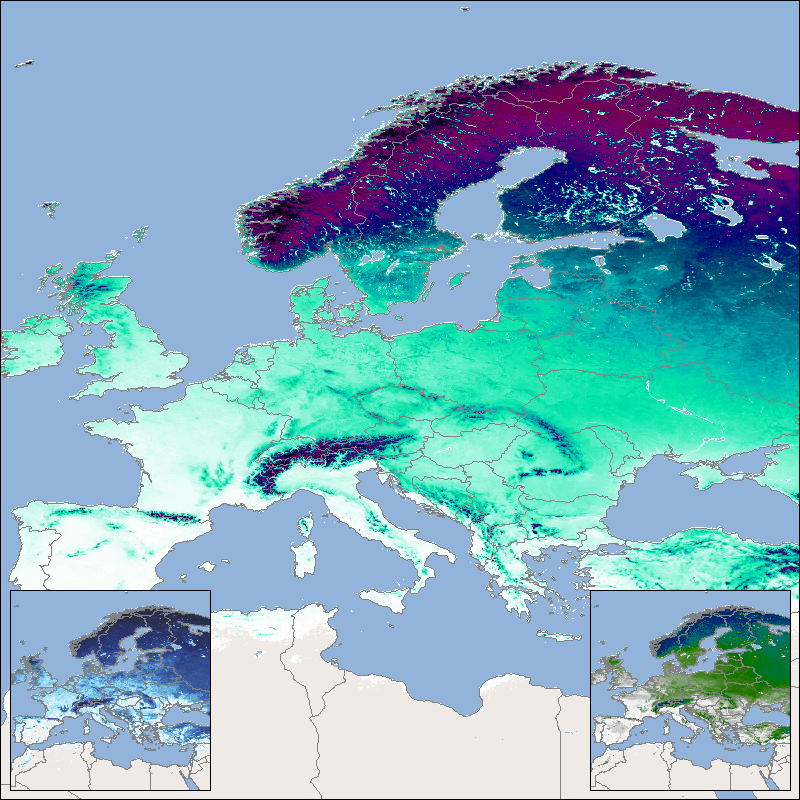
This product shows the snow cover duration for a hydrological year. Its beginning differs from the calendar year, since some of the precipitation that falls in late autumn and winter falls as snow and only drains away when the snow melts in the following spring or summer. The meteorological seasons are used for subdivision and the hydrological year begins in autumn and ends in summer. The snow cover duration is made available for three time periods: the snow cover duration for the entire hydrological year (SCD), the early snow cover duration (SCDE), which extends from autumn to midwinter (), and the late snow cover duration (SCDL), which in turn extends over the period from mid-winter to the end of summer. For the northern hemisphere SCD lasts from September 1st to August 31st, for the southern hemisphere it lasts from March 1st to February 28th/29th. The SCDE lasts from September 1st to January 14th in the northern hemisphere and from March 1st to July 14th in the southern hemisphere. The SCDL lasts from January 15th to August 31st in the northern hemisphere and from July 15th to February 28th/29th in the southern hemisphere. The “Global SnowPack” is derived from daily, operational MODIS snow cover product for each day since February 2000. Data gaps due to polar night and cloud cover are filled in several processing steps, which provides a unique global data set characterized by its high accuracy, spatial resolution of 500 meters and continuous future expansion. It consists of the two main elements daily snow cover extent (SCE) and seasonal snow cover duration (SCD; full and for early and late season). Both parameters have been designated by the WMO as essential climate variables, the accurate determination of which is important in order to be able to record the effects of climate change. Changes in the largest part of the cryosphere in terms of area have drastic effects on people and the environment. For more information please also refer to: Dietz, A.J., Kuenzer, C., Conrad, C., 2013. Snow-cover variability in central Asia between 2000 and 2011 derived from improved MODIS daily snow-cover products. International Journal of Remote Sensing 34, 3879–3902. https://doi.org/10.1080/01431161.2013.767480 Dietz, A.J., Kuenzer, C., Dech, S., 2015. Global SnowPack: a new set of snow cover parameters for studying status and dynamics of the planetary snow cover extent. Remote Sensing Letters 6, 844–853. https://doi.org/10.1080/2150704X.2015.1084551 Dietz, A.J., Wohner, C., Kuenzer, C., 2012. European Snow Cover Characteristics between 2000 and 2011 Derived from Improved MODIS Daily Snow Cover Products. Remote Sensing 4. https://doi.org/10.3390/rs4082432 Dietz, J.A., Conrad, C., Kuenzer, C., Gesell, G., Dech, S., 2014. Identifying Changing Snow Cover Characteristics in Central Asia between 1986 and 2014 from Remote Sensing Data. Remote Sensing 6. https://doi.org/10.3390/rs61212752 Rößler, S., Witt, M.S., Ikonen, J., Brown, I.A., Dietz, A.J., 2021. Remote Sensing of Snow Cover Variability and Its Influence on the Runoff of Sápmi’s Rivers. Geosciences 11, 130. https://doi.org/10.3390/geosciences11030130
-

This product shows the mean snow cover duration (SCDmean), which is updated each year and consists of the arithmetic mean for the entire time series since the hydrological year 2001. The hydrological year begins in the meteorological autumn (October 1 of the previous year in the northern hemisphere or March 1 of the reference year in the southern hemisphere) and ends with the meteorological summer (northern hemisphere: August 31 of the reference year; southern hemisphere: February 28/29 of the following year). Analogous to the annual products for snow cover duration, the entire year as well as the early season (until mid-winter) and the late season (from mid-winter) are taken into account here. The “Global SnowPack” is derived from daily, operational MODIS snow cover product for each day since February 2000. Data gaps due to polar night and cloud cover are filled in several processing steps, which provides a unique global data set characterized by its high accuracy, spatial resolution of 500 meters and continuous future expansion. It consists of the two main elements daily snow cover extent (SCE) and seasonal snow cover duration (SCD; full and for early and late season). Both parameters have been designated by the WMO as essential climate variables, the accurate determination of which is important in order to be able to record the effects of climate change. Changes in the largest part of the cryosphere in terms of area have drastic effects on people and the environment. For more information please also refer to: Dietz, A.J., Kuenzer, C., Conrad, C., 2013. Snow-cover variability in central Asia between 2000 and 2011 derived from improved MODIS daily snow-cover products. International Journal of Remote Sensing 34, 3879–3902. https://doi.org/10.1080/01431161.2013.767480 Dietz, A.J., Kuenzer, C., Dech, S., 2015. Global SnowPack: a new set of snow cover parameters for studying status and dynamics of the planetary snow cover extent. Remote Sensing Letters 6, 844–853. https://doi.org/10.1080/2150704X.2015.1084551 Dietz, A.J., Wohner, C., Kuenzer, C., 2012. European Snow Cover Characteristics between 2000 and 2011 Derived from Improved MODIS Daily Snow Cover Products. Remote Sensing 4. https://doi.org/10.3390/rs4082432 Dietz, J.A., Conrad, C., Kuenzer, C., Gesell, G., Dech, S., 2014. Identifying Changing Snow Cover Characteristics in Central Asia between 1986 and 2014 from Remote Sensing Data. Remote Sensing 6. https://doi.org/10.3390/rs61212752 Rößler, S., Witt, M.S., Ikonen, J., Brown, I.A., Dietz, A.J., 2021. Remote Sensing of Snow Cover Variability and Its Influence on the Runoff of Sápmi’s Rivers. Geosciences 11, 130. https://doi.org/10.3390/geosciences11030130
-
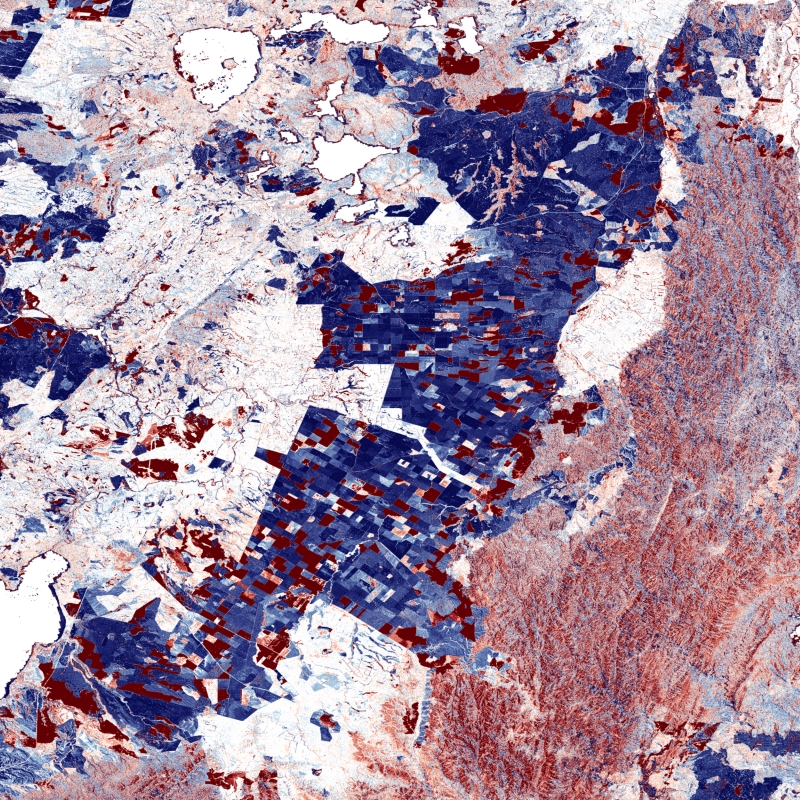
The TanDEM-X DEM Change Maps is a project developed by the Institute Remote Sensing Technology (IMF) at the German Aerospace Center (DLR) within the activities of the TanDEM-X Mission. Between 2016 and 2022, the TanDEM-X mission acquired an additional complete coverage of the Earth's landmass to deliver a temporally independent coverage within a well-defined time span. These new acquisitions not only provide more up-to-date elevation information, but also a great dataset to show the changes that have occurred during the years separating this new coverage from the coverages acquired to generate the TanDEM-X global DEM (between 2011 and 2014). This product - the TanDEM-X 30 m DEM Change Maps - shows the changes between the edited first global TanDEM-X DEM (TanDEM-X 30m Edited DEM) and the newly acquired time-tagged DEM scenes. In order to keep a unique timestamp, two change maps are available per tile: one with the change to the oldest pixel in the new dataset - the first DEM change, and another with the change to the newest pixel of the new dataset - the last DEM change. The two maps differ only when there are multiple coverages. Users must be aware that a given elevation change measured in the DEM change maps corresponds to a topographic change with respect to TanDEM-X 30m EDEM, but cannot be associated with a corresponding physical height change of the same magnitude. This is due to the fact that the global TanDEM-X DEM reflects an averaged elevation derived from the combination of different images, acquired over a period of several years but also because the radar waves penetrate differently in the surface depending on the attributes of the land cover. This is especially important over vegetated and snow-covered regions.
-
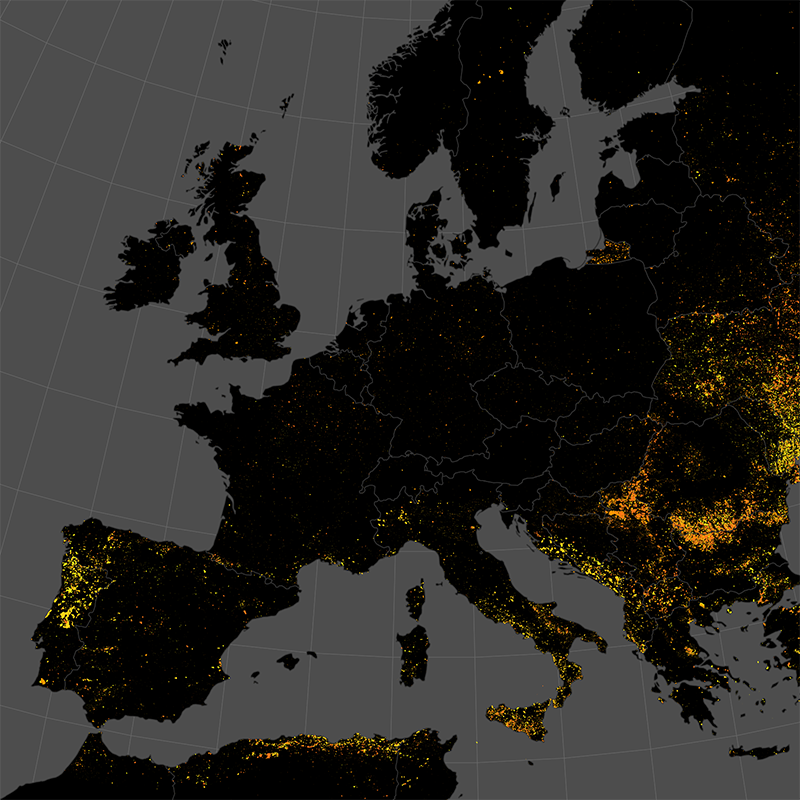
The product is automatically derived from Aqua/Terra (MODIS) satellite imagery in near-real time. It is an incremental product, meaning that the retrieved results are updated as soon as new input data becomes available over a timespan of ten days. Besides the fire perimeter and detection time, each feature contains information about the severity of the burning.