 INSPIRE-1
Keyword
DLR
12 record(s)
Provided by
Type of resources
Available actions
Topics
Keywords
Contact for the resource
Update frequencies
Service types
-
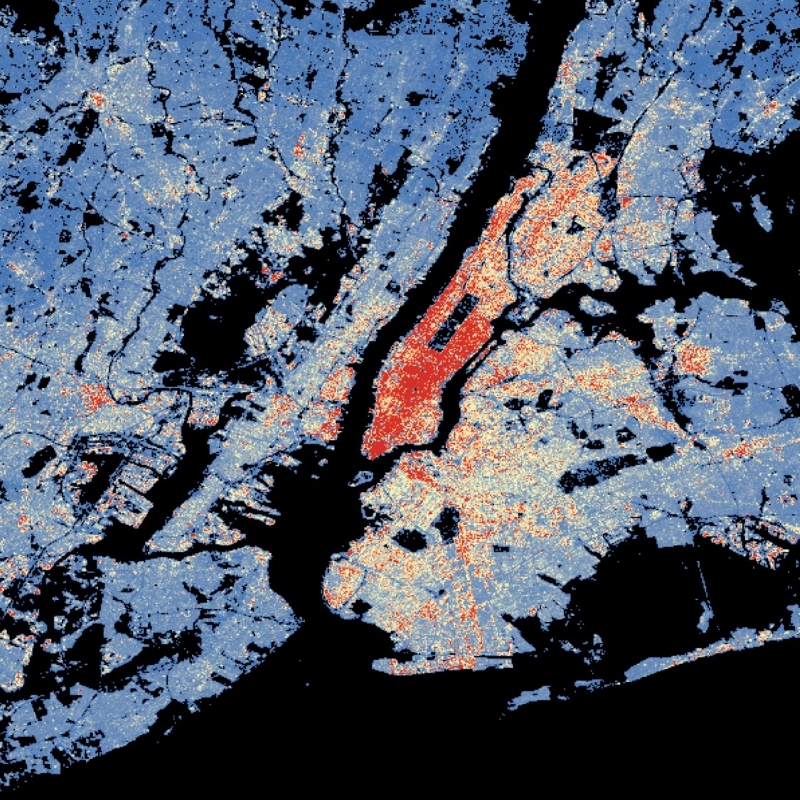
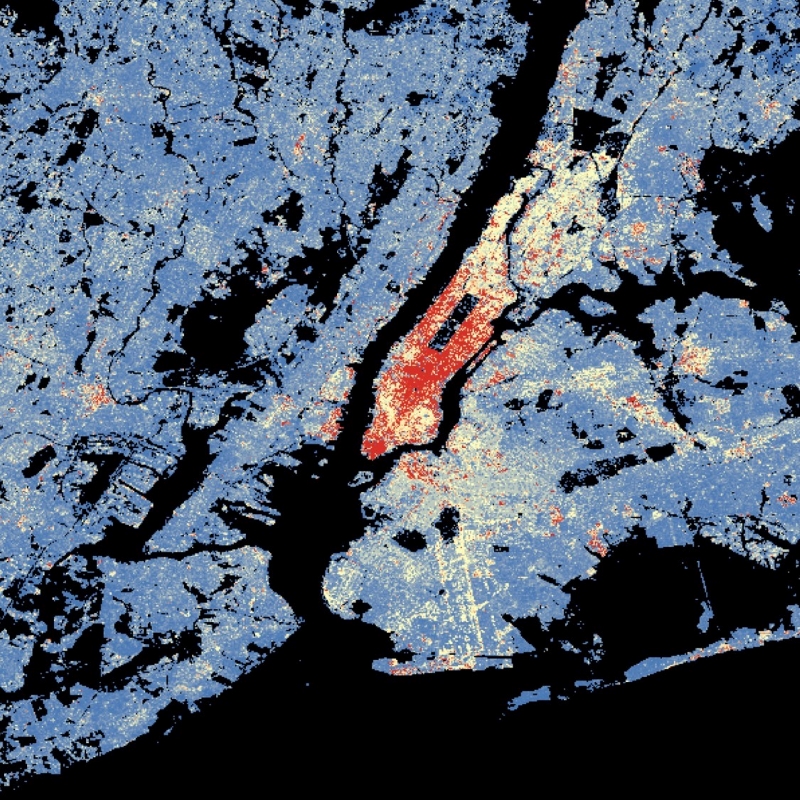
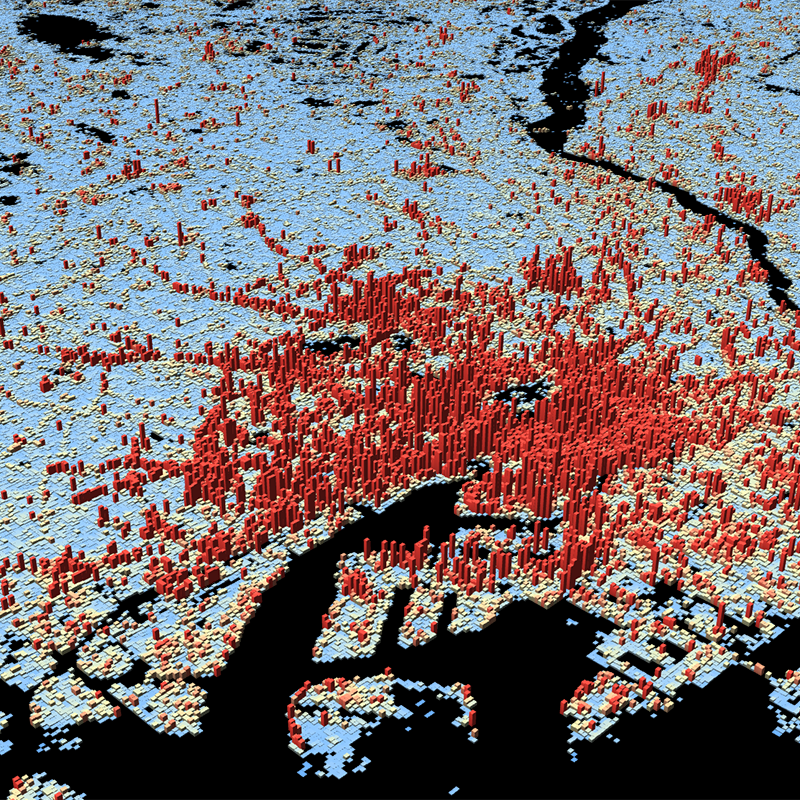
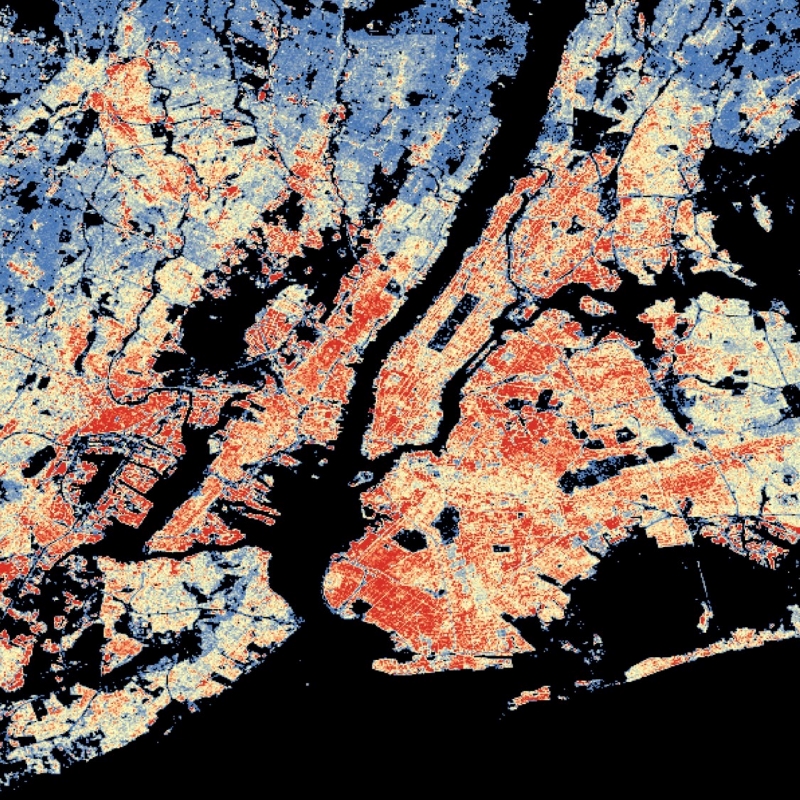
The World Settlement Footprint (WSF) 3D provides detailed quantification of the average height, total volume, total area and the fraction of buildings at 90 m resolution at a global scale. It is generated using a modified version of the World Settlement Footprint human settlements mask derived from Sentinel-1 and Sentinel-2 satellite imagery in combination with digital elevation data and radar imagery collected by the TanDEM-X mission. The framework includes three basic workflows: i) the estimation of the mean building height based on an analysis of height differences along potential building edges, ii) the determination of building fraction and total building area within each 90 m cell, and iii) the combination of the height information and building area in order to determine the average height and total built-up volume at 90 m gridding. In addition, global height information on skyscrapers and high-rise buildings provided by the Emporis database is integrated into the processing framework, to improve the WSF 3D Building Height and subsequently the Building Volume Layer. A comprehensive validation campaign has been performed to assess the accuracy of the dataset quantitatively by using VHR 3D building models from 19 globally distributed regions (~86,000 km2) as reference data. The WSF 3D standard layers are provided in the format of Lempel-Ziv-Welch (LZW)-compressed GeoTiff files, with each file - or image tile - covering an area of 1 x 1 ° geographical lat/lon at a geometric resolution of 2.8 arcsec (~ 90 m at the equator). Following the system established by the TDX-DEM mission, the latitude resolution is decreased in multiple steps when moving towards the poles to compensate for the reduced circumference of the Earth.
-
This dataset is a derivative of the WSF3D raster dataset tailored for the web. As a tiled vector dataset, it enables dynamic client-side visualization of the WSF3D metrics
-

The World Settlement Footprint (WSF) 3D provides detailed quantification of the average height, total volume, total area and the fraction of buildings at 90 m resolution at a global scale. It is generated using a modified version of the World Settlement Footprint human settlements mask derived from Sentinel-1 and Sentinel-2 satellite imagery in combination with digital elevation data and radar imagery collected by the TanDEM-X mission. The framework includes three basic workflows: i) the estimation of the mean building height based on an analysis of height differences along potential building edges, ii) the determination of building fraction and total building area within each 90 m cell, and iii) the combination of the height information and building area in order to determine the average height and total built-up volume at 90 m gridding. In addition, global height information on skyscrapers and high-rise buildings provided by the Emporis database is integrated into the processing framework, to improve the WSF 3D Building Height and subsequently the Building Volume Layer. A comprehensive validation campaign has been performed to assess the accuracy of the dataset quantitatively by using VHR 3D building models from 19 globally distributed regions (~86,000 km2) as reference data. The WSF 3D standard layers are provided in the format of Lempel-Ziv-Welch (LZW)-compressed GeoTiff files, with each file - or image tile - covering an area of 1 x 1 ° geographical lat/lon at a geometric resolution of 2.8 arcsec (~ 90 m at the equator). Following the system established by the TDX-DEM mission, the latitude resolution is decreased in multiple steps when moving towards the poles to compensate for the reduced circumference of the Earth.
-
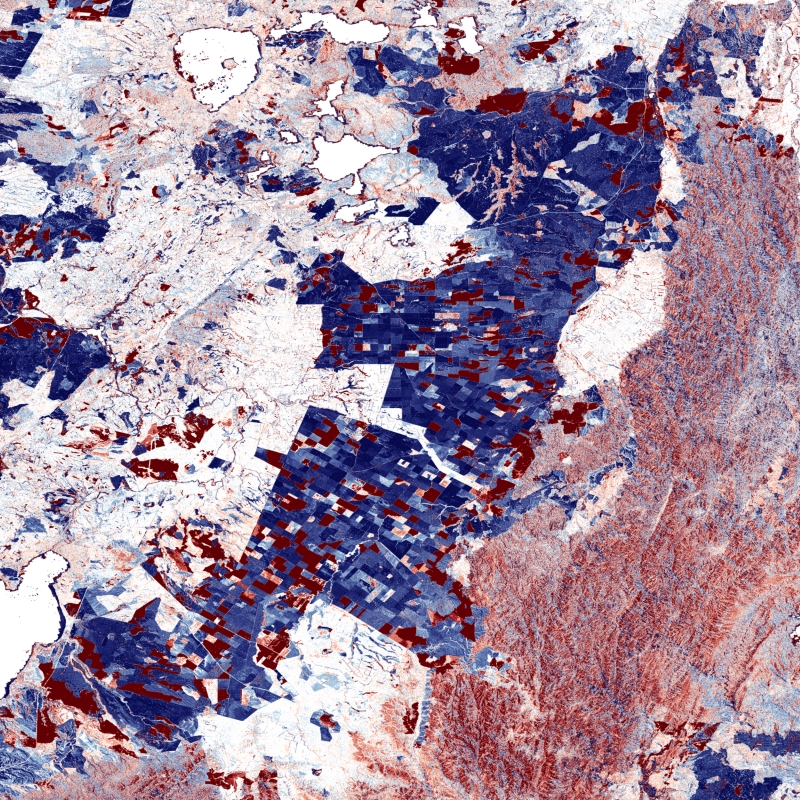
The TanDEM-X DEM Change Maps is a project developed by the Institute Remote Sensing Technology (IMF) at the German Aerospace Center (DLR) within the activities of the TanDEM-X Mission. Between 2016 and 2022, the TanDEM-X mission acquired an additional complete coverage of the Earth's landmass to deliver a temporally independent coverage within a well-defined time span. These new acquisitions not only provide more up-to-date elevation information, but also a great dataset to show the changes that have occurred during the years separating this new coverage from the coverages acquired to generate the TanDEM-X global DEM (between 2011 and 2014). This product - the TanDEM-X 30 m DEM Change Maps - shows the changes between the edited first global TanDEM-X DEM (TanDEM-X 30m Edited DEM) and the newly acquired time-tagged DEM scenes. In order to keep a unique timestamp, two change maps are available per tile: one with the change to the oldest pixel in the new dataset - the first DEM change, and another with the change to the newest pixel of the new dataset - the last DEM change. The two maps differ only when there are multiple coverages. Users must be aware that a given elevation change measured in the DEM change maps corresponds to a topographic change with respect to TanDEM-X 30m EDEM, but cannot be associated with a corresponding physical height change of the same magnitude. This is due to the fact that the global TanDEM-X DEM reflects an averaged elevation derived from the combination of different images, acquired over a period of several years but also because the radar waves penetrate differently in the surface depending on the attributes of the land cover. This is especially important over vegetated and snow-covered regions.
-
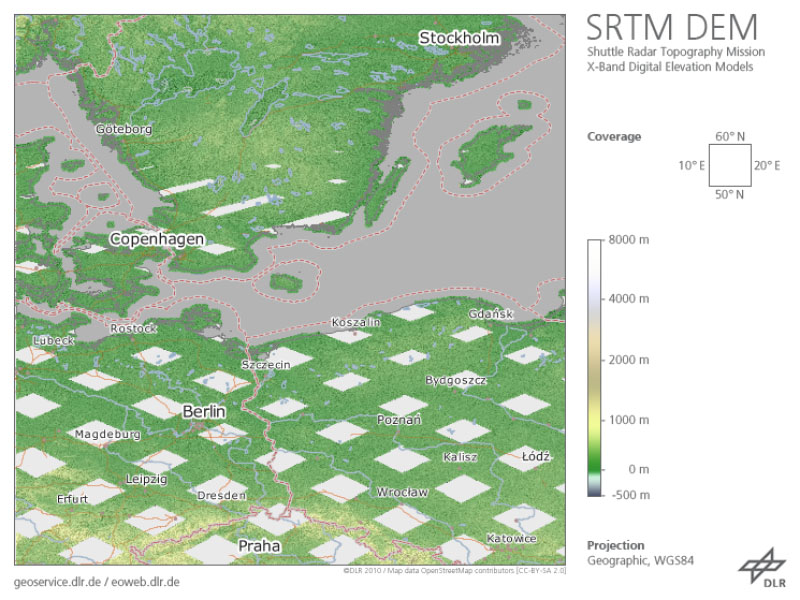
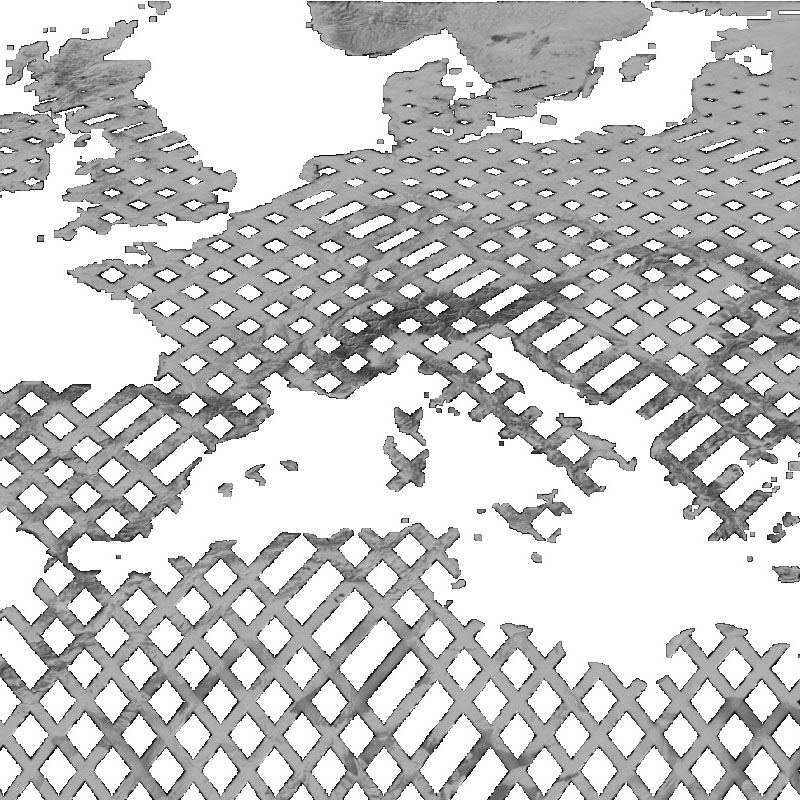
The Shuttle Radar Topography Mission (SRTM, DTS-99) from February 11 to 22, 2000 was an US-German-Italian effort to produce a first global digital elevation model (DEM). The German Aerospace Center (DLR) and the Italian Space Agency (ASI) complemented the US C-band Synthetic Aperture Radar (SAR) payload of NASA/JPL with an additional X-SAR instrument. The SRTM X-SAR DEM was generated at DLR from this instrument’s data using radar interferometry technique. The data was acquired simultaneously from aboard the Space Shuttle Endeavor employing two SAR antennas, one inside the Space Shuttle’s cargo bay, the other at the end of a 60 m extension pole. A substantial portion of the global land surface between 60° northern and 58° southern latitude was covered. As the orbit flown and imaging period of the SRTM mission had been optimized for the US C-band system, the German-Italian X-SAR with narrower aperture angle imaged data only along roughly 50 km wide orbital ground traces. Therefore, the dataset available shows a grid-like coverage. The original SRTM X-SAR DTED DEMs have been merged to 10° by 10° tiles, converted to GeoTIFF format and packaged into zip-archives. Each zip-file contains the DEM dataset, the corresponding height error map (HEM), a quicklook png-image, a kml-overlay and a readme document. The filename of the zip-archive specifies the bottom left coordinate of each tile. The zip-archives can be downloaded via the EOC Download Service. For more information see: https://geoservice.dlr.de/resources/licenses/srtm_xsar/DLR_SRTM_XSAR_ReadMe.pdf
-
The SRTM X-SAR Hillshade Mosaic is a greyscale shaded relief based on the SRTM X-SAR Elevation Mosaic. Combined with the latter, it can be used to add a 3d effect and enhance the visual resolution by pronouncing peaks and valleys.
-

The SRTM X-SAR Error Mosaic is based on the height error map (HEM, see SRTM PDF http://www.dlr.de/eoc/Portaldata/60/Resources/dokumente/7_sat_miss/SRTM-XSAR-DEM-DTED-1.1.pdf) and provides a local measure of the achieved accuracy. It is statistically determined from a neighborhood of image cells mainly considering the phase and baseline stability. Thus it describes the precision relative to the surrounding. The determination of the absolute accuracy requires the consideration of reference measures.
-
This WMS provides access to different elevation products provided by the Earth Observation Center (EOC) of the DLR.