 INSPIRE-1
Keyword
Global
12 record(s)
Provided by
Type of resources
Available actions
Topics
Keywords
Contact for the resource
Update frequencies
Service types
-
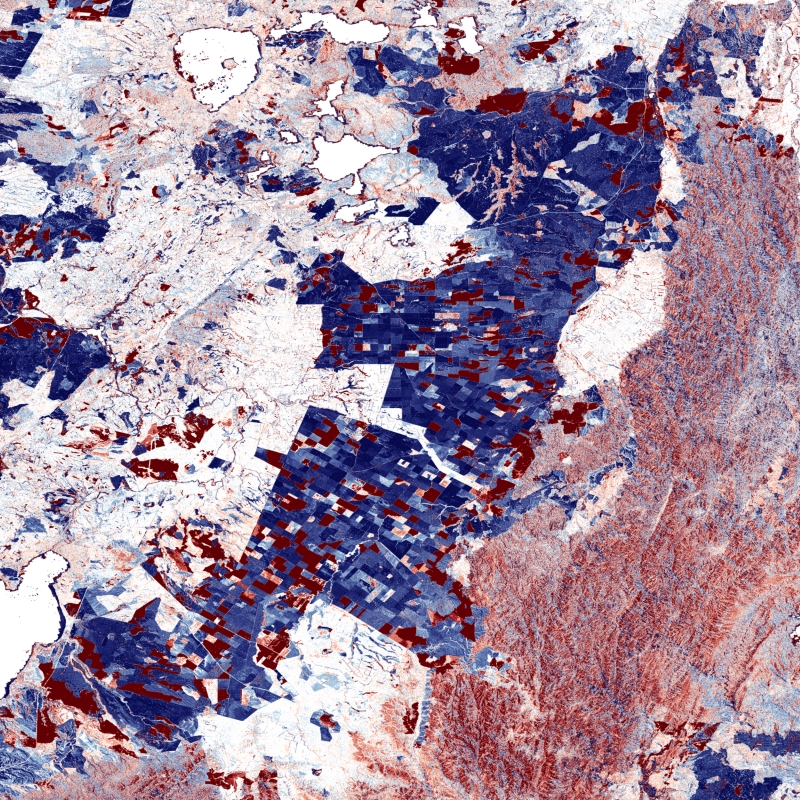
The TanDEM-X DEM Change Maps is a project developed by the Institute Remote Sensing Technology (IMF) at the German Aerospace Center (DLR) within the activities of the TanDEM-X Mission. Between 2016 and 2022, the TanDEM-X mission acquired an additional complete coverage of the Earth's landmass to deliver a temporally independent coverage within a well-defined time span. These new acquisitions not only provide more up-to-date elevation information, but also a great dataset to show the changes that have occurred during the years separating this new coverage from the coverages acquired to generate the TanDEM-X global DEM (between 2011 and 2014). This product - the TanDEM-X 30 m DEM Change Maps - shows the changes between the edited first global TanDEM-X DEM (TanDEM-X 30m Edited DEM) and the newly acquired time-tagged DEM scenes. In order to keep a unique timestamp, two change maps are available per tile: one with the change to the oldest pixel in the new dataset - the first DEM change, and another with the change to the newest pixel of the new dataset - the last DEM change. The two maps differ only when there are multiple coverages. Users must be aware that a given elevation change measured in the DEM change maps corresponds to a topographic change with respect to TanDEM-X 30m EDEM, but cannot be associated with a corresponding physical height change of the same magnitude. This is due to the fact that the global TanDEM-X DEM reflects an averaged elevation derived from the combination of different images, acquired over a period of several years but also because the radar waves penetrate differently in the surface depending on the attributes of the land cover. This is especially important over vegetated and snow-covered regions.
-
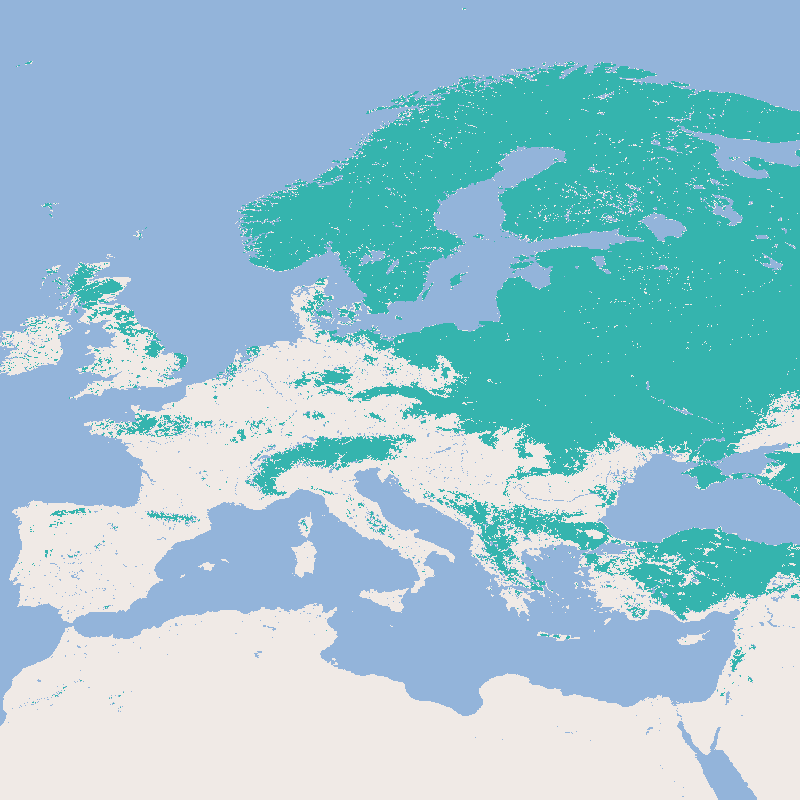
This product shows globally the daily snow cover extent (SCE). The snow cover extent is the result of the Global SnowPack processor's interpolation steps and all data gaps have been filled. Snow cover extent is updated daily and processed in near real time (3 days lag). In addition to the near real-time product (NRT_SCE), the entire annual data set is processed again after the end of a calendar year in order to close data gaps etc. and the result is made available as a quality-tested SCE product. There is also a quality layer for each day (SCE_Accuracy), which reflects the quality of the snow determination based on the time interval to the next "cloud-free" day, the time of year and the topographical/geographical location. The “Global SnowPack” is derived from daily, operational MODIS snow cover product for each day since February 2000. Data gaps due to polar night and cloud cover are filled in several processing steps, which provides a unique global data set characterized by its high accuracy, spatial resolution of 500 meters and continuous future expansion. It consists of the two main elements daily snow cover extent (SCE) and seasonal snow cover duration (SCD; full and for early and late season). Both parameters have been designated by the WMO as essential climate variables, the accurate determination of which is important in order to be able to record the effects of climate change. Changes in the largest part of the cryosphere in terms of area have drastic effects on people and the environment. For more information please also refer to: Dietz, A.J., Kuenzer, C., Conrad, C., 2013. Snow-cover variability in central Asia between 2000 and 2011 derived from improved MODIS daily snow-cover products. International Journal of Remote Sensing 34, 3879–3902. https://doi.org/10.1080/01431161.2013.767480 Dietz, A.J., Kuenzer, C., Dech, S., 2015. Global SnowPack: a new set of snow cover parameters for studying status and dynamics of the planetary snow cover extent. Remote Sensing Letters 6, 844–853. https://doi.org/10.1080/2150704X.2015.1084551 Dietz, A.J., Wohner, C., Kuenzer, C., 2012. European Snow Cover Characteristics between 2000 and 2011 Derived from Improved MODIS Daily Snow Cover Products. Remote Sensing 4. https://doi.org/10.3390/rs4082432 Dietz, J.A., Conrad, C., Kuenzer, C., Gesell, G., Dech, S., 2014. Identifying Changing Snow Cover Characteristics in Central Asia between 1986 and 2014 from Remote Sensing Data. Remote Sensing 6. https://doi.org/10.3390/rs61212752 Rößler, S., Witt, M.S., Ikonen, J., Brown, I.A., Dietz, A.J., 2021. Remote Sensing of Snow Cover Variability and Its Influence on the Runoff of Sápmi’s Rivers. Geosciences 11, 130. https://doi.org/10.3390/geosciences11030130
-
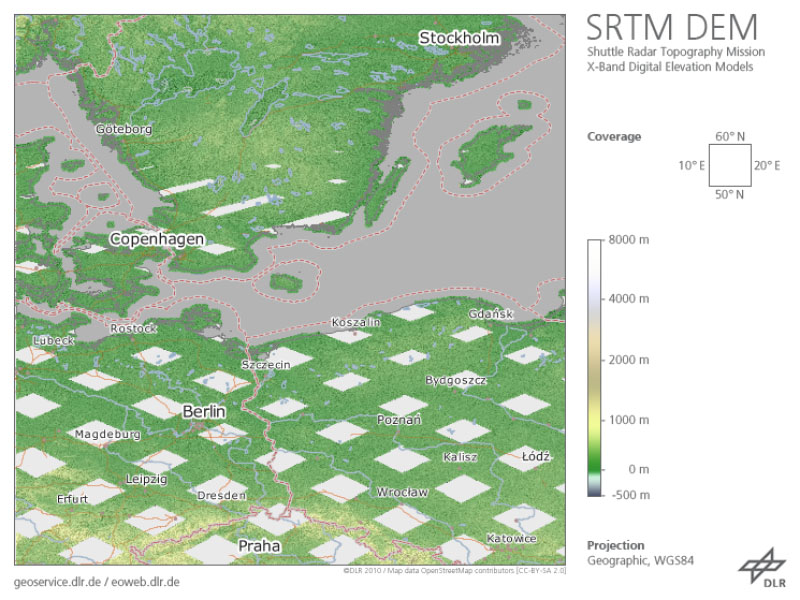
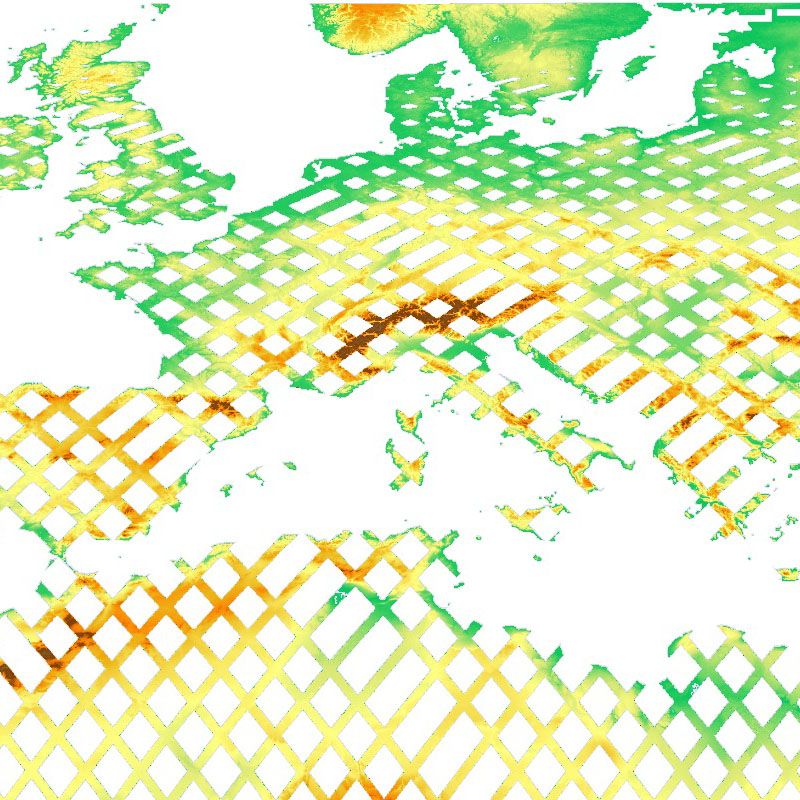
The Shuttle Radar Topography Mission (SRTM, DTS-99) from February 11 to 22, 2000 was an US-German-Italian effort to produce a first global digital elevation model (DEM). The German Aerospace Center (DLR) and the Italian Space Agency (ASI) complemented the US C-band Synthetic Aperture Radar (SAR) payload of NASA/JPL with an additional X-SAR instrument. The SRTM X-SAR DEM was generated at DLR from this instrument’s data using radar interferometry technique. The data was acquired simultaneously from aboard the Space Shuttle Endeavor employing two SAR antennas, one inside the Space Shuttle’s cargo bay, the other at the end of a 60 m extension pole. A substantial portion of the global land surface between 60° northern and 58° southern latitude was covered. As the orbit flown and imaging period of the SRTM mission had been optimized for the US C-band system, the German-Italian X-SAR with narrower aperture angle imaged data only along roughly 50 km wide orbital ground traces. Therefore, the dataset available shows a grid-like coverage. The original SRTM X-SAR DTED DEMs have been merged to 10° by 10° tiles, converted to GeoTIFF format and packaged into zip-archives. Each zip-file contains the DEM dataset, the corresponding height error map (HEM), a quicklook png-image, a kml-overlay and a readme document. The filename of the zip-archive specifies the bottom left coordinate of each tile. The zip-archives can be downloaded via the EOC Download Service. For more information see: https://geoservice.dlr.de/resources/licenses/srtm_xsar/DLR_SRTM_XSAR_ReadMe.pdf
-
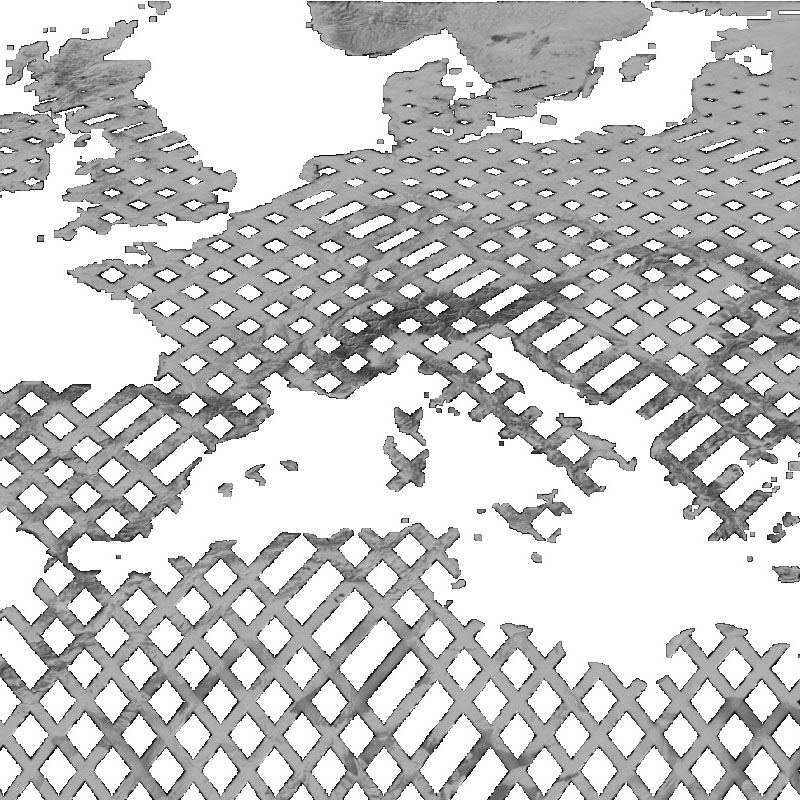
The SRTM X-SAR Hillshade Mosaic is a greyscale shaded relief based on the SRTM X-SAR Elevation Mosaic. Combined with the latter, it can be used to add a 3d effect and enhance the visual resolution by pronouncing peaks and valleys.
-

The SRTM X-SAR Error Mosaic is based on the height error map (HEM, see SRTM PDF http://www.dlr.de/eoc/Portaldata/60/Resources/dokumente/7_sat_miss/SRTM-XSAR-DEM-DTED-1.1.pdf) and provides a local measure of the achieved accuracy. It is statistically determined from a neighborhood of image cells mainly considering the phase and baseline stability. Thus it describes the precision relative to the surrounding. The determination of the absolute accuracy requires the consideration of reference measures.
-
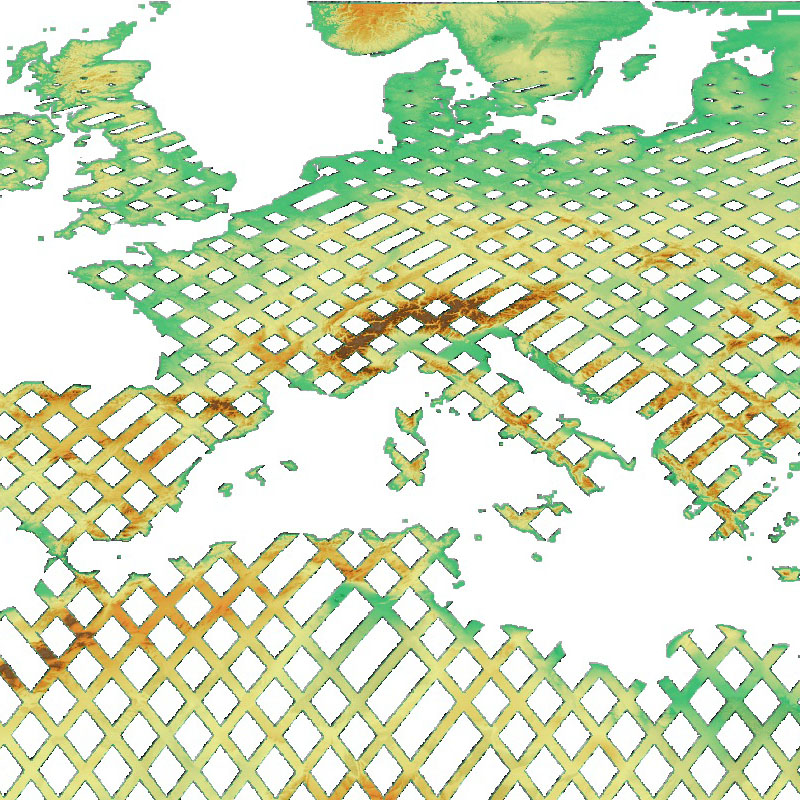
The SRTM X-SAR Elevation Mosaic is an aggregation of DLR's SRTM X-SAR DTED files. The DTED Level-2 files have been generated from Synthetic Aperture Radar (SAR) data acquired by the German-Italian X-band interferometric SAR system during the Shuttle Radar Topography Mission (SRTM) between February 11 and 22, 2000. The X-band system was flown and operated onboard the Space Shuttle Endeavor, along with a NASA C-Band SAR system. The SRTM project page at DLR provides additional information on the SRTM X-band mission ( http://www.dlr.de/eoc/en/desktopdefault.aspx/tabid-5515/9214_read-17716/ ). Further details on the mission in general, the technology, accuracies, and applications are available in http://www2.jpl.nasa.gov/srtm/SRTM_paper.pdf . The original DTED files have been grouped and mosaicked into 30 x 30 degree tiles. Six out of the total of 48 tiles were empty since they do not contain any DTED files. The resulting 42 tiles are stored as uncompressed GeoTIFF files. The files have been supplemented with nine cubic convolution resampled overviews for fast web delivery.
-
TanDEM-X (TerraSAR-X add-on for Digital Elevation Measurements) is an Earth observation radar mission that consists of a SAR interferometer built by two almost identical satellites flying in close formation. With a typical separation between the satellites of 120m to 500m a global Digital Elevation Model (DEM) has been generated. The main objective of the TanDEM-X mission is to create a precise 3D map of the Earth's land surfaces that is homogeneous in quality and unprecedented in accuracy. The data acquisition was completed in 2015 and production of the global DEM was completed in September 2016. The absolute height error is with about 1m an order of magnitude below the 10m requirement. The TanDEM-X 90m DEM is a product variant of the global Digital Elevation Model (DEM) acquired in the frame of the German TanDEM-X mission between 2010 and 2015, and has a reduced pixel spacing of 3 arcseconds (90m at the equator). It covers all Earth’s landmasses from pole to pole. For more information concerning the TanDEM-X 90m DEM, the reader is referred to: https://tandemx-90m.dlr.de/ For more information concerning the TanDEM-X mission, the reader is referred to: https://www.dlr.de/dlr/en/desktopdefault.aspx/tabid-10378/
-
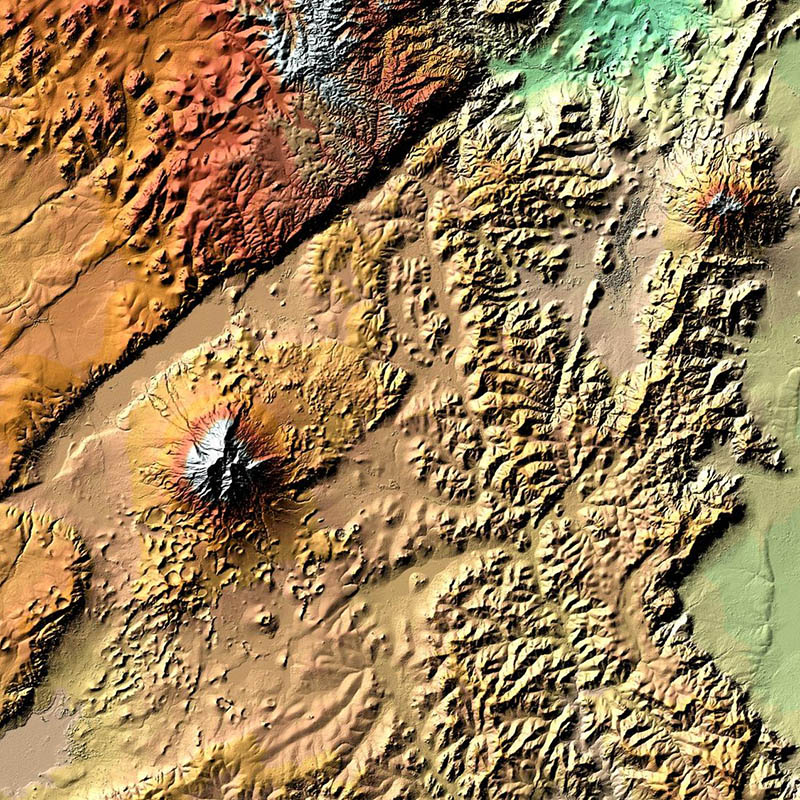
The SRTM X-SAR Elevation Mosaic is an aggregation of DLR's SRTM X-SAR DTED tiles. The SRTM X-SAR Color-Coded Elevation Mosaic combines the SRTM X-SAR Elevation and Hillshade Mosaic Datasets to produce a hypsometric colored and shaded relief of the SRTM X-SAR DTED tiles.
-
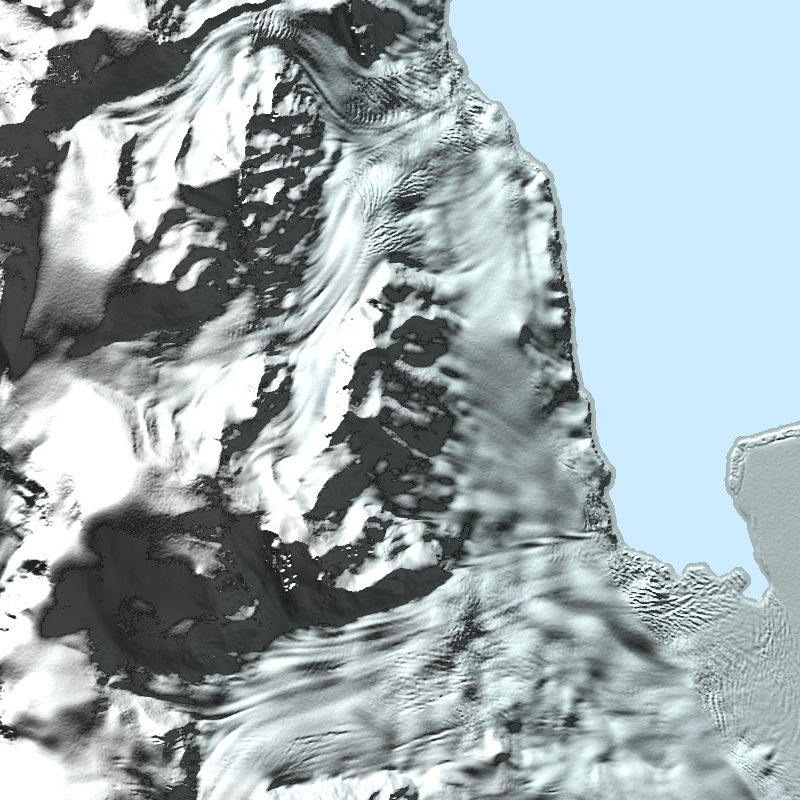
The TanDEM-X PolarDEM is a project developed by the German Remote Sensing Data Center (DFD) at the German Aerospace Center (DLR) within the activities of the TanDEM-X mission. It is a framework for the provision of derivatives of the global Digital Elevation Model (DEM) of the TanDEM-X mission for Polar Regions. The TanDEM-X PolarDEM 90m of Antarctica is a gap-free and edited version of the TanDEM-X 90m digital elevation model (DEM). The TanDEM-X PolarDEM 90m of Antarctica is provided in Antarctic Polar Stereographic projection (EPSG:3031) with a pixel spacing of 90 meters. The DEM elevation values represent ellipsoidal heights relative to the WGS84 ellipsoid. The majority of the data were acquired between April 2013 and October 2014. The TanDEM-X PolarDEM 90m of Antarctica is split into four tiles. For more information concerning the TanDEM-X PolarDEM, the reader is referred to: https://www.dlr.de/eoc/en/desktopdefault.aspx/tabid-11882/20871_read-66374/
-
Der Datensatz enthält die Forschungsschiffe der hydrografische Messungen mehrerer wissenschaftlicher Kreuzfahrten des Thuenen-Instituts für Seefischerei.